Data Analysis Case Studies
We introduce case studies of analysis using contents archived in the National Diet Library Web Archiving Project (WARP).
(The articles are written in Japanese.)
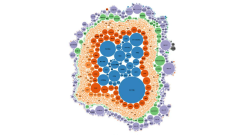
- Visualization of the Websites Archived in WARP
- This bubble chart shows the relative size of data accumulated from each of the 14,000 websites archived in WARP. Thus, you can see at a glance what websites and how much data are archived in WARP.
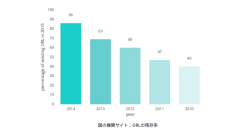
- What Percentage of URLs and Content on Websites Are Gone?
- We extracted 10 million files from archived websites of national institutions, and examined the percentage of URLs and content which have vanished over the past 5 years.
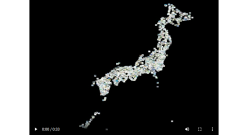
- Japanese Archipelago in WARP
- Here is a moving image that shows how much WARP archived websites of local governments by year from 2003 to 2015. Local governments' home pages captured by WARP are arranged according to their actual position, and those websites make the Japanese archipelago.
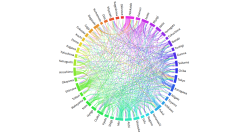
- Link Relations between Websites in Japan's 47 Prefectures
- The circular graph illustrates links between websites in Japan's 47 prefectures, thereby showing the extent of their interconnection on the web.